IoT Patent Diagrams
IoT claims live at three altitudes — the device, the network, and the method running across both. Each altitude has its own diagram type, and the set only works when the three agree with each other and with the claims.
- Three-tier topology diagrams
- Node exploded views
- Protocol flowcharts
- Claim-consistent device counts
The 30-second answer
- Map the claim altitudes: system claims → device-gateway-cloud topology block diagram, device claims → exploded or block view of the node, method claims → flowcharts that mirror the claim steps, security claims → provisioning sequence flows.
- Draw the cloud as a plain labeled block or outline with a reference numeral — not decorative art — and make the number of devices in the topology match what the claims recite.
- Generate each diagram from a description or sketch in PatentFig AI and check the set against office rules before filing.
IoT diagram examples
Each example is a fictional invention. Open one to pre-fill the generator with the prompt.
Which figures support which claims
IoT claims come at three altitudes — give each one its canonical diagram.
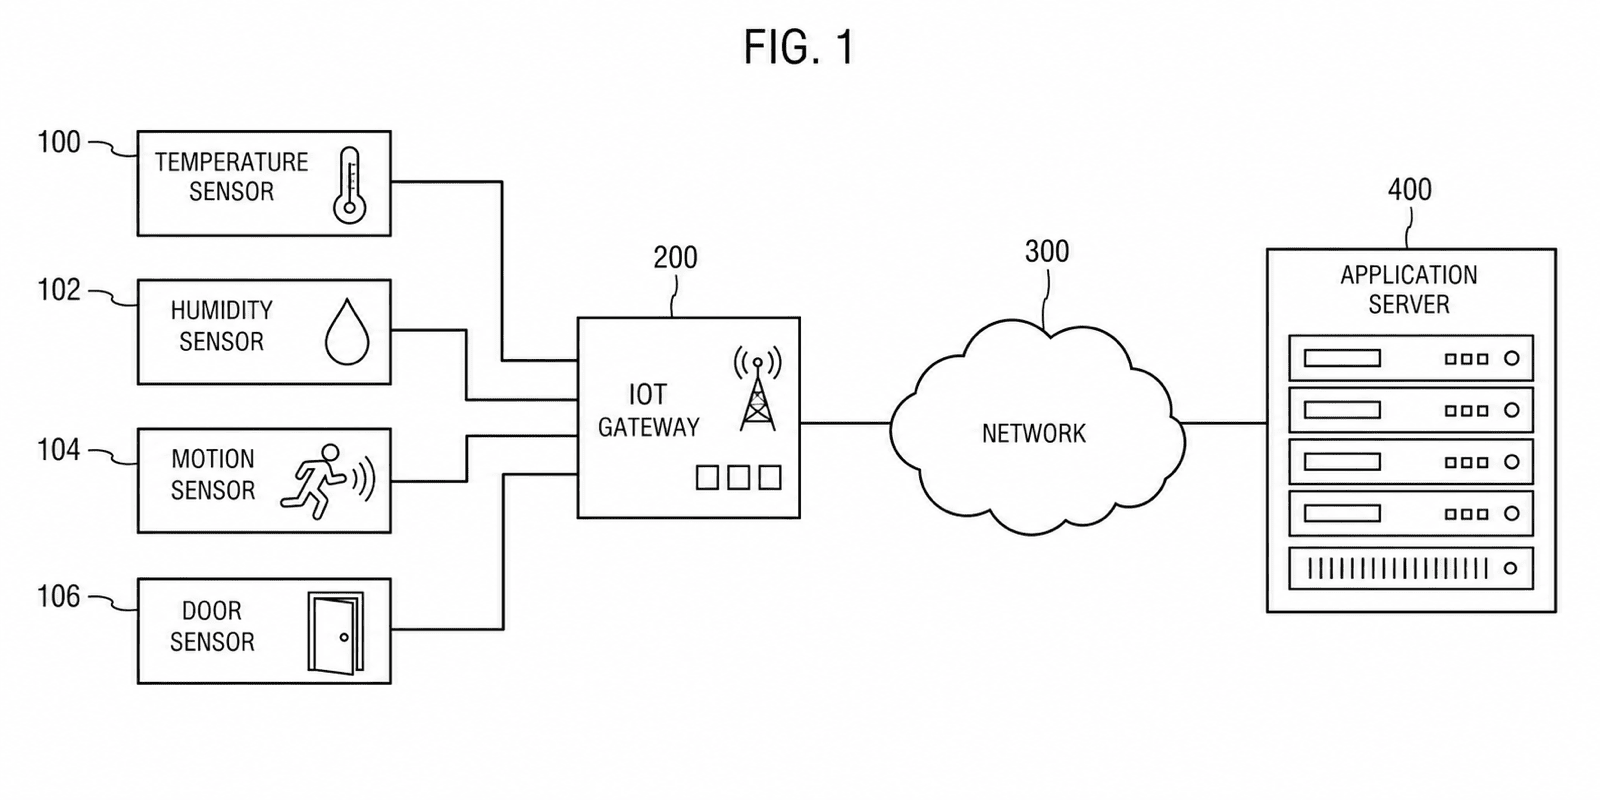
System claims → three-tier topology block diagrams
Edge devices, gateway, and cloud platform as labeled blocks in three tiers, with numbered communication links — the figure the system claim recites element by element.
Device claims → exploded or block views
The sensor node opened up: housing, PCB, sensor module, radio, antenna, and battery as an exploded view, or as a hardware block diagram when internals are electronic.
Protocol and method claims → flowcharts
Numbered steps that mirror the claim language exactly — detect, transmit, acknowledge, retry — so each claim step cites one box.
Security and provisioning claims → sequence-style flows
Device, gateway, and server as columns with numbered messages between them: enrollment, key exchange, attestation — the structure authentication claims need.
Data-processing claims → pipeline block diagrams
Ingestion, edge filtering, aggregation, and cloud analytics as numbered stages with data-flow arrows.
IoT diagram mistakes that cost office actions
The failure patterns specific to connected-device figures.
The decorative cloud
A fluffy artistic cloud with no numeral is ornament, not disclosure. Draw the cloud platform as a labeled block or plain outline with a reference numeral like every other element.
Device counts that contradict the claims
Claims reciting "a plurality of sensor nodes" supported by a single node — or three nodes when the claim logic requires two classes — invite objections. Make the topology mirror the claim.
The missing gateway tier
Collapsing device-to-cloud into one arrow when the claims recite a gateway or hub erases a claimed element. Every recited tier needs its block.
Unnumbered protocol steps
A flowchart without step numerals cannot be cited from the specification or the claims. Number every box (102, 104, …) and keep the series per figure.
Generic diagram tools vs. PatentFig AI
Visio can draw a network diagram; a patent figure has stricter rules and a longer set to stay consistent with.
PatentFig AI is the better fit when
- The application needs topology diagrams, device views, and flowcharts in one consistent set
- Method steps must be renumbered as claims are amended
- Architecture sketches and slide diagrams are your starting material
- You file the family beyond the USPTO and need multi-office checks
Other tools fit better when
- You only need an engineering network diagram, not a patent figure
- The claims are pure software with no device layer — a generic flowchart tool may suffice
- A litigation-grade set needs a specialist’s certification
Industry guide
IoT patent diagrams FAQ
Diagram the whole stack
Topology, node, and protocol — generate a consistent IoT figure set and check it against six offices.